Published: July 2021
Like us, you have probably been watching as much of this year’s Tour de France as possible, then getting out on your bike, inspired to replicate the riders. We can see how amazing these athletes are just by watching and comparing their efforts to our own abilities, but how much better are they than your average cyclist?
In this article, we’re going to use a series of statistics to see how the average cyclist stacks up against a Grand Tour pro.
Calories

A 2019 study showed that Tour de France cyclists hit athletic endurance limits during the three weeks. They are almost freaks of nature at that point, managing to produce around five times their basal metabolic rate (number of calories you use on a rest day) without losing significant weight.
The estimated average number of calories burned on each stage is 3,000 to 5,500. This means the peloton must consume three times more calories than an average person when racing, which comes out at about 6,000-7,000 calories per stage. This figure is comparable to the average cyclist who would also burn this number if they were to do a five-hour bike ride. However, the difference comes when you factor in everything else in this article. Namely, keeping on top of this calorie deficit for 21 days, while also focussing on all the other on-bike things a pro must do to stay on top of their form. It’s one thing getting your nutrition right on a training ride, but it’s another thing getting it right while racing the Tour de France.
Power

Ever since Chris Froome started staring at his stem and not at the road in front of him a, huge deal has been made about rider’s power data. This obsession with watts and FTP results is something that has dripped down from the top echelons of the sport all the way down to the casual club ride. Whether you find these statistics un-important and over-analysed or not, they are a good way of comparing the average cyclist to a Tour rider.
The latest analysis of data from this year’s Tour de France comes in the form of Ben O’Connor’s stage 9-winning ride. His normalised power was 344 watts for 4 hours, 37 minutes that included a sustained period of 403 watts for 22 minutes when he was trying to get into the day’s breakaway. That’s on a mountain stage too; sprinters like Mark Cavendish will hit an eye-watering 1,600-1,900 watts during a bunch kick.
In comparison, the average fighting fit amateur cyclist will average 200 watts or lower over the same period. With pros (male and female) usually hitting an FTP of up to 7.0w/kg and amateurs (male and female) averaging at 2.0-3.1 w/kg, it’s safe to say you would be ridden off the wheel almost instantaneously. Comparing power can be a bit misleading though as it relies heavily on a rider’s weight, so a more consistent variable would be something like speed.
Speed

There is no data to substantiate the value of a high average speed - that is, slow does not necessarily equal bad. It is understood however that if you do a bike ride at an average of over 30km/h you are on a decent day, although terrain and duration will obviously have a big impact - don’t feel bad if your day in the mountains doesn’t seem up to scratch. On the other hand, during the 2019 Tour de France, overall winner Egan Bernal recorded an average speed of 40.58km/h over 3,366km spread across 21 stages. The slowest Tour was in 1919 - 5,560km in 15 stages - when Firmin Lambot won with an average speed of 24.1km/h on a single-speed bike (yup) that was significantly heavier than any on the market today. Now compare these numbers to your latest Strava file…
Interested in more Grand Tour facts you may not know? Check out 6 Things You May Not Know About The Grand Tours.
Elevation

When the riders of this year’s Tour de France cross the final finish line on the Champs-Élysées, they will have overcome 51,153 metres of elevation. To put this substantial number into context, that’s nearly six Everests. In comparison, data from the 2019 Strava end-of-year recap shows that the average user climbed 25,833 metres in total all year (or three Everests), i.e. three weeks of Tour climbing = twice what the average cyclist achieves in 52 weeks. This shows just how incredible Tour de France cyclists are. So, the next time a rider misses the time cut on a mountain stage, keep in mind how many Everests they may already have in their legs.
Time in the saddle

The total distance of the 2021 Tour is 3,414 kilometres, with stages from 27.2km in to 249.1km - incidentally, the longest stage in over 20 years. Riders are usually in the saddle for three and a half to five hours (give or take the two time trials) for each of the 21 days. Just thinking about those statistics makes you reach for the chamois cream, as according to Strava, in 2020 the average distance per ride in the UK was 20.2 kilometres and the average duration was just over one hour.
But how do amateurs compare to professionals across the same course? A good way to work this out is by looking at L’Étape du Tour, the official sportive of the Tour de France. The last Étape to shadow the exact route of a stage was the 2018 edition which followed stage 10 of that year’s route. It was a grizzly ride that featured 4,756 metres of climbing, including the Col de la Colombière. The stage winner in the Tour was Julian Alaphilippe in a time of 4:25:27. The lead rider at the Étape was Victor Lafay in a time of 5:15:52. Lafay is hardly your average cyclist though as he now rides for Cofidis and won a stage of this year’s Giro d’Italia. However, back then in 2018 he was top amateur on the same course and would have finished outside the time limit had he been at the Tour proper.
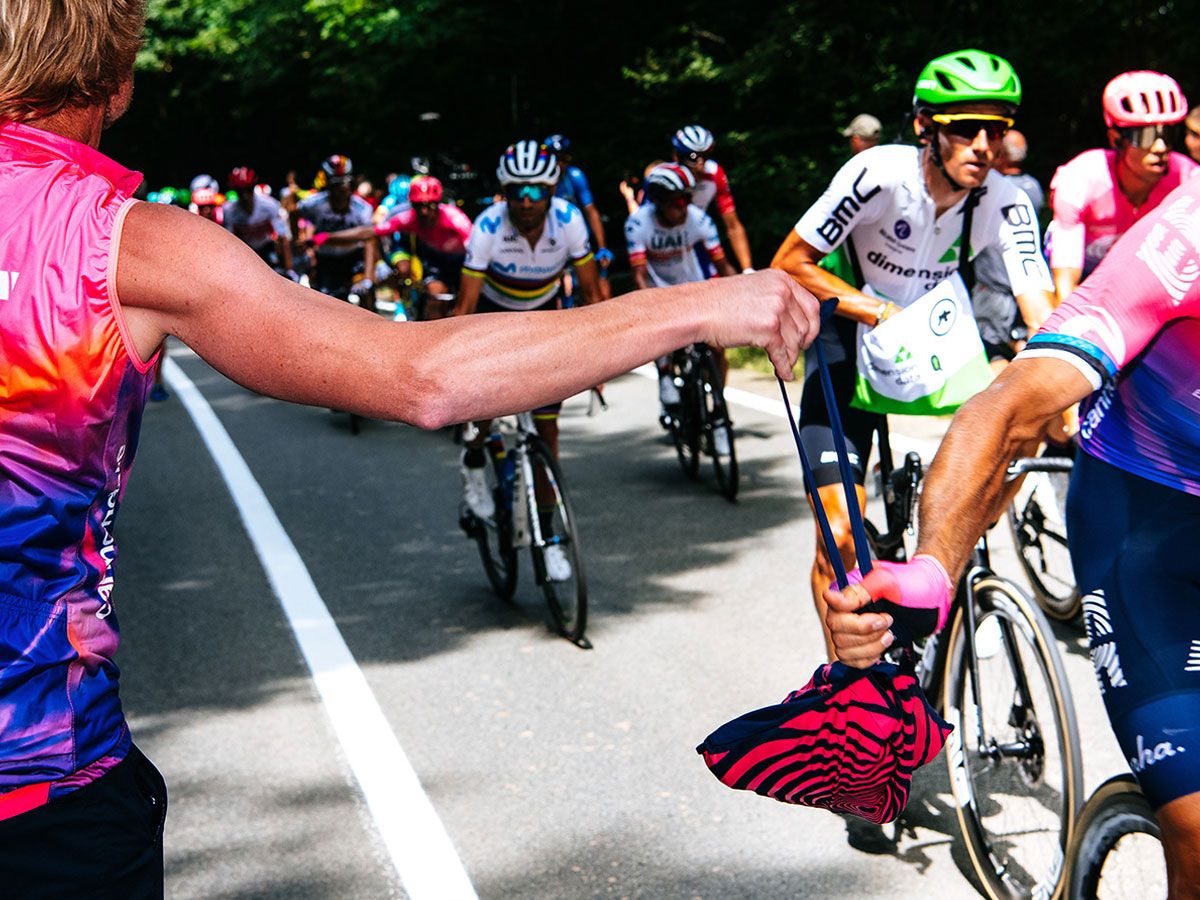
So, that’s what separates Tour de France cyclists from us mere mortals, but don’t despair. Keep in mind that every professional bike rider devotes every waking hour to their career and they don’t have to squeeze training in around a nine-to-five job. They’ve also got an extensive support system of coaching and nutrition staff, carers and mechanics, not to mention a good supply of all the kit and equipment they could possibly need - all factors that definitely make life (and quality training) much easier.
Pedalsure can’t follow you around the country lanes with a spare bike on the roof of the car and a radio delivering motivation into your ears, but we can look after you in other ways. If you take out a Pedalsure cycle insurance policy, you, your bike and your accessories will be protected in mass participation events and races, in cases of bike theft, personal injury, personal liability, at home and abroad. Most of what we cover you won’t find in your home insurance policies, so don’t drop the ball on this one and follow our quick and easy quote process today.
Get one step closer to the care and attention experienced by pro cyclists with comprehensive cycle insurance from us. Get a quote today.
